Velocity-Time graph gives two most important parameter.
1) Its slope gives the acceleration.
2. The area under the curve gives the distance traveled by an object.
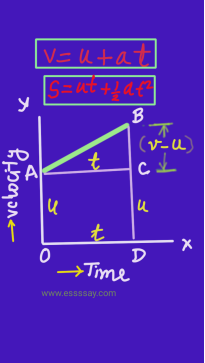
Here we will derive velocity(v = u + at) equation as shown the figure.
And
we will also derive graphically distance (s = ut + 1/2 a t2) equation. Analytically we can derive velocity equation as follow.
s = distance
v = final velocity
u = initial velocity
t = time
Acceleration = rate of change of velocity.
a = (v-u) /t
at = v – u
v = u + at Which is the equation of velocity.
Analytical derivation of distance equation.
distance = velocity x time
s = v.t
If the acceleration is uniform , then velocity will change its value uniformlly. i.e. v= 1/2 (v + u)
s = v.t
s = 1/2 (v + u). t
But v = u+ at
Putting the value of v in above equation we get
s = 1/2 {(u + at) + u}. t
s = 1/2 (2u + at). t
s = 1/2 .2u. t + 1/2. at 2
s = u t + 1/2 at 2 Which is the equation of distance in terms of u and t
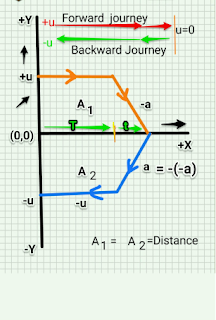
Let us explain this graph. An object start moving with an initial velocity u . It moves with this constant velocity (u) for T second. After that it retards with acceleration a and stops after t second. After that it returns backward and accelerat for t second with an acceleration a. See the negative side graph of y-axis. It accelerates for t seconds. Then it moves with constant velocity u for further T seconds and come back to its original position. The distance covered is same in the forward and backward journey. Therefore area under the upper curve and lover curve is same. .


